MNIST TUTORIAL#
|
|
 View source on GitHub View source on GitHub
|
|
Start EVA server#
We are reusing the start server notebook for launching the EVA server.
!wget -nc "https://raw.githubusercontent.com/georgia-tech-db/eva/master/tutorials/00-start-eva-server.ipynb"
%run 00-start-eva-server.ipynb
cursor = connect_to_server()
File ‘00-start-eva-server.ipynb’ already there; not retrieving.
[notice] A new release of pip is available: 23.0.1 -> 23.1.2
[notice] To update, run: pip install --upgrade pip
Note: you may need to restart the kernel to use updated packages.
nohup eva_server > eva.log 2>&1 &
[notice] A new release of pip is available: 23.0.1 -> 23.1.2
[notice] To update, run: pip install --upgrade pip
Note: you may need to restart the kernel to use updated packages.
Downloading the videos#
# Getting MNIST as a video
!wget -nc https://www.dropbox.com/s/yxljxz6zxoqu54v/mnist.mp4
# Getting a udf
!wget -nc https://raw.githubusercontent.com/georgia-tech-db/eva/master/tutorials/apps/mnist/eva_mnist_udf.py
File ‘mnist.mp4’ already there; not retrieving.
File ‘eva_mnist_udf.py’ already there; not retrieving.
Upload the video for analysis#
cursor.execute('DROP TABLE IF EXISTS MNISTVid')
response = cursor.fetch_all()
response.as_df()
cursor.execute("LOAD VIDEO 'mnist.mp4' INTO MNISTVid")
response = cursor.fetch_all()
response.as_df()
| 0 | |
|---|---|
| 0 | Number of loaded VIDEO: 1 |
Visualize Video#
from IPython.display import Video
Video("mnist.mp4", embed=True)
Create an user-defined function (UDF) for analyzing the frames#
cursor.execute("""CREATE UDF IF NOT EXISTS
                  MnistCNN
                  INPUT  (data NDARRAY (3, 28, 28))
                  OUTPUT (label TEXT(2))
                  TYPE  Classification
                  IMPL  'eva_mnist_udf.py'
        """)
response = cursor.fetch_all()
response.as_df()
| 0 | |
|---|---|
| 0 | UDF MnistCNN successfully added to the database. |
Run the Image Classification UDF on video#
cursor.execute("""SELECT data, MnistCNN(data).label
                  FROM MNISTVid
                  WHERE id = 30 OR id = 50 OR id = 70 OR id = 0 OR id = 140""")
response = cursor.fetch_all()
response.as_df()
| mnistvid.data | mnistcnn.label | |
|---|---|---|
| 0 | [[[0, 0, 0], [0, 0, 0], [0, 0, 0], [0, 0, 0], ... | 6 |
| 1 | [[[2, 2, 2], [2, 2, 2], [2, 2, 2], [2, 2, 2], ... | 2 |
| 2 | [[[13, 13, 13], [2, 2, 2], [2, 2, 2], [13, 13,... | 3 |
| 3 | [[[0, 0, 0], [0, 0, 0], [0, 0, 0], [0, 0, 0], ... | 7 |
| 4 | [[[0, 0, 0], [0, 0, 0], [0, 0, 0], [0, 0, 0], ... | 5 |
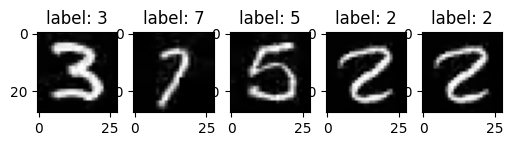
Visualize output of query on the video#
# !pip install matplotlib
import matplotlib.pyplot as plt
import numpy as np

# create figure (fig), and array of axes (ax)
fig, ax = plt.subplots(nrows=1, ncols=5, figsize=[6,8])

df = response.batch.frames
for axi in ax.flat:
    idx = np.random.randint(len(df))
    img = df['mnistvid.data'].iloc[idx]
    label = df['mnistcnn.label'].iloc[idx]
    axi.imshow(img)

    axi.set_title(f'label: {label}')

plt.show()